(Note: This is a reply to Mr. G.'s thread in USeP-IC Web Forum - Assignment 10: With reference to assignments 8 and 9, what characteristics does an analyst(you) examine when evalauating DFD quality?)
As a review, assignments 8 and 9 illustrate the activity diagram and data flow diagram of the university’s pre-enrollment system. These diagrams describe more or less the flow of the system based on the real and actual scenario in the school. Since there is a need to thoroughly understand the concepts of what is happening in the structure of the organization, the system analyst have to use these modeling techniques which will aid him or her in determining which components are lacking and needs attention. This is vital especially if the organization is aiming for progress and expansion.
Basically, when you are evaluating a particular system, you have to review the things and events that are involved in the processes. Requirements must be modeled out so to have a better representation and understanding. Apart from mathematical models which represent series of formulas and descriptive models which are narrative in forms, most models used in system analysis and design are graphical models being characterized by diagrams and schematic representations of some aspects of the system. Mainly, these models describe the details of what the system does when an event occurs. They are created to activities of information systems and interactions between computer processes and data.
There are however traditional (system is a collection of processes) and object-oriented (system is a collection of interacting objects) approaches to modeling system requirements. The data flow diagram (DFD) is one of the traditional approaches. Symbols that are used in data flow diagram comprise of the following:

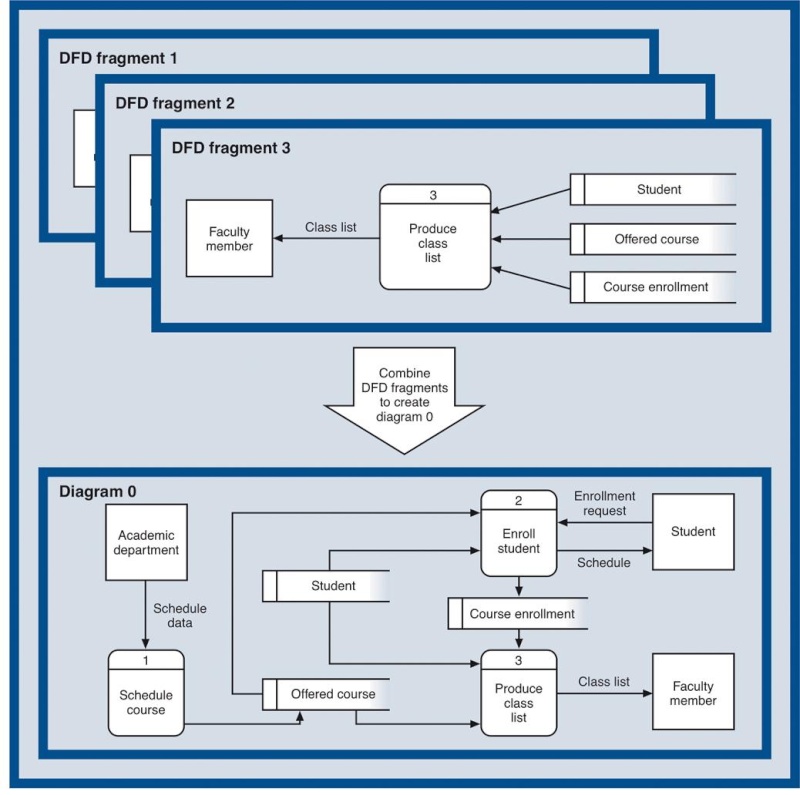
Data flow diagrams (DFDs) are decomposed into additional diagrams to provide multiple levels of detail (System Analysis and Design in a Changing World, Satzinger et al). There are two classifications of the views in data flow diagrams: the higher – level diagrams and lower – level diagrams. Higher – level diagrams provide the general views of the system while the lower – level provide the detailed views of the system. Such differing views are termed as levels of abstractions. In a particular system, there could be many representations of data flow diagrams. The highest level or the most abstract view of the system is represented by context diagram. It is here where the data flow diagram summarizes the processing activity for the system or subsystem. The system scope in a context diagram is said to be represented by a single process, external agents, and all data which flows into and out of the system. DFD fragments are also created and represent the response of the system to an event within a single process symbol. These decomposed fragments also take the form of a lower – level diagram (sometimes called as diagram 0), which composed of detailed flow or just combined DFD fragments to model a specified view of the system.

Data flow diagrams are just one of the basic models being used by systems analysts in representing important and vital aspects of the system. As mentioned, DFDs alone have differing characteristics and these facets are not that easy to point out and visualize if the system analyst has not studied the procedures of the system in bird’s eye. Being very keen to detail is number one behavior for me that has to be possessed by a system analyst. You can just imagine the complexity that a single simple process of a system or subsystem can have that an analyst has to figure out and studied. Secondly, due to complexity of the system, an analyst needs to aim for accuracy and completeness. He/she must be able to define every event and thing involved and occurring within the activities of the system to be able to find out the components of the data flow diagram. He/she must be able to capture the overview of the running system, and make out a high-level DFD where the general view of the system is modeled out. Apart from being familiar of the system in whole, a system analyst now has to be familiar with the specific processes, expanding more of the general view into a more detailed data flow diagram combining DFD fragments into processes. As to my technique, I have yet to identify the overall course of action in the system and draft it as a context diagram. Then based on each major process, I examined each and expanded the diagram into a more specific diagram involving the fragments.
Furthermore, one quality of a data flow diagram that a system analyst has to make sure is that it should be readable. There might be individuals (probably clients) who are not into information systems and may not have knowledge about these matters. But it is important to know that they must also be able to comprehend the flow of the actual system as what and how the model describes it. Secondly, it has to be internally consistent and balanced. A data flow diagram model would not be able to explain a well-defined structure and process of the system if it is not balanced. Thus it should be internally coherent. Finally, and the most crucial, is that a data flow diagram must accurately represent the system requirements, for its goal is to characterize the procedure and the in and out flow of data in the running system. That’s what I’ve been stressing in the previous statements.


Many thanks to the resources I have used as my references and aid:
Chapter 4 Investigating System Requirements
Chapter 5 Modeling System Requirements
Chapter 6 Traditional Approach to Requirements
from System Analysis and Design in a Changing World by Satzinger, Jackson, and Burd
Microsoft Encarta Dictionaries and Thesaurus

Basically, when you are evaluating a particular system, you have to review the things and events that are involved in the processes. Requirements must be modeled out so to have a better representation and understanding. Apart from mathematical models which represent series of formulas and descriptive models which are narrative in forms, most models used in system analysis and design are graphical models being characterized by diagrams and schematic representations of some aspects of the system. Mainly, these models describe the details of what the system does when an event occurs. They are created to activities of information systems and interactions between computer processes and data.
There are however traditional (system is a collection of processes) and object-oriented (system is a collection of interacting objects) approaches to modeling system requirements. The data flow diagram (DFD) is one of the traditional approaches. Symbols that are used in data flow diagram comprise of the following:
Data flow diagrams (DFDs) are decomposed into additional diagrams to provide multiple levels of detail (System Analysis and Design in a Changing World, Satzinger et al). There are two classifications of the views in data flow diagrams: the higher – level diagrams and lower – level diagrams. Higher – level diagrams provide the general views of the system while the lower – level provide the detailed views of the system. Such differing views are termed as levels of abstractions. In a particular system, there could be many representations of data flow diagrams. The highest level or the most abstract view of the system is represented by context diagram. It is here where the data flow diagram summarizes the processing activity for the system or subsystem. The system scope in a context diagram is said to be represented by a single process, external agents, and all data which flows into and out of the system. DFD fragments are also created and represent the response of the system to an event within a single process symbol. These decomposed fragments also take the form of a lower – level diagram (sometimes called as diagram 0), which composed of detailed flow or just combined DFD fragments to model a specified view of the system.
Data flow diagrams are just one of the basic models being used by systems analysts in representing important and vital aspects of the system. As mentioned, DFDs alone have differing characteristics and these facets are not that easy to point out and visualize if the system analyst has not studied the procedures of the system in bird’s eye. Being very keen to detail is number one behavior for me that has to be possessed by a system analyst. You can just imagine the complexity that a single simple process of a system or subsystem can have that an analyst has to figure out and studied. Secondly, due to complexity of the system, an analyst needs to aim for accuracy and completeness. He/she must be able to define every event and thing involved and occurring within the activities of the system to be able to find out the components of the data flow diagram. He/she must be able to capture the overview of the running system, and make out a high-level DFD where the general view of the system is modeled out. Apart from being familiar of the system in whole, a system analyst now has to be familiar with the specific processes, expanding more of the general view into a more detailed data flow diagram combining DFD fragments into processes. As to my technique, I have yet to identify the overall course of action in the system and draft it as a context diagram. Then based on each major process, I examined each and expanded the diagram into a more specific diagram involving the fragments.
Furthermore, one quality of a data flow diagram that a system analyst has to make sure is that it should be readable. There might be individuals (probably clients) who are not into information systems and may not have knowledge about these matters. But it is important to know that they must also be able to comprehend the flow of the actual system as what and how the model describes it. Secondly, it has to be internally consistent and balanced. A data flow diagram model would not be able to explain a well-defined structure and process of the system if it is not balanced. Thus it should be internally coherent. Finally, and the most crucial, is that a data flow diagram must accurately represent the system requirements, for its goal is to characterize the procedure and the in and out flow of data in the running system. That’s what I’ve been stressing in the previous statements.
Many thanks to the resources I have used as my references and aid:
Chapter 4 Investigating System Requirements
Chapter 5 Modeling System Requirements
Chapter 6 Traditional Approach to Requirements
from System Analysis and Design in a Changing World by Satzinger, Jackson, and Burd
Microsoft Encarta Dictionaries and Thesaurus
No comments:
Post a Comment